


Here is the second part of our two-part series about the office market. In this article, we dive into trends by region. (Click here to see Part I.)
Vacancy Trends
Among the top 40 U.S. office markets represented in the chart below, several cities with persistently high vacancy rates saw improvement in the second quarter of 2025, including San Jose, Calif., (down 110 bps) and San Francisco (down 100 bps), according to CBRE.
Tech and AI-related companies absorbed space in both cities, and the absence of Q2 completions further supported the decline.
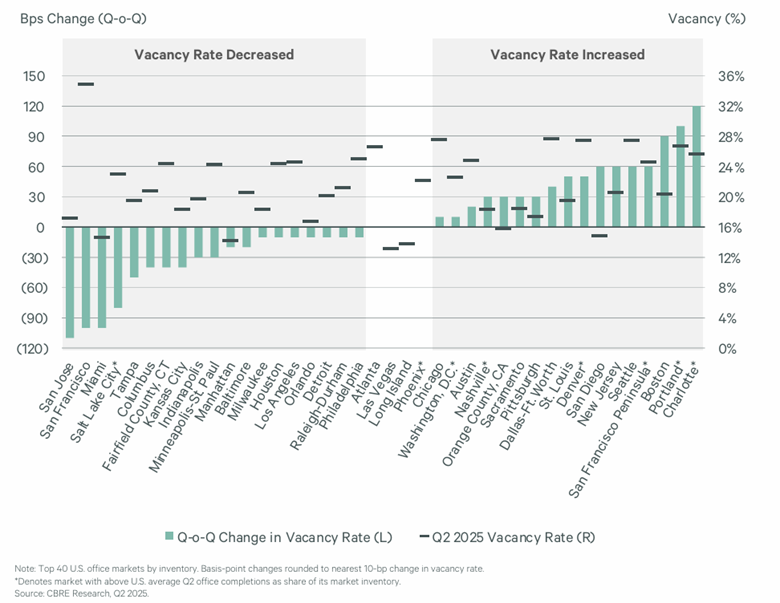
While San Francisco has the highest vacancy rate among the markets covered — hovering around 35% — this decrease signals movement in the right direction.
Outside the West Coast, Miami, Salt Lake City and Tampa, Fla., recorded the largest quarter-over-quarter declines.
The Midwest also saw improvement, particularly in Columbus, Ohio, Kansas City, Indianapolis and Minneapolis/St. Paul.
Conversely, new construction contributed to rising vacancy rates in Charlotte, N.C., (up 120 bps), Portland, Ore., (up 100 bps), Denver (up 50 bps) and Nashville, Tenn., (up 30 bps).
While Charlotte, Portland and Boston recorded the largest increases, other markets — including Seattle, New Jersey, San Diego, Denver, St. Louis, Dallas/Fort Worth, Pittsburgh, Sacramento, Orange County, Calif., and Nashville — also saw rates rise.
Overall, the highest vacancy rates were in San Francisco (35%), while Atlanta, Chicago, Dallas/Fort Worth, Seattle and Portland, were each around 26%.
The lowest rates were in Miami, Manhattan, Las Vegas, Long Island, N.Y., Orange County and San Diego, each around 14%.
Employment Trends
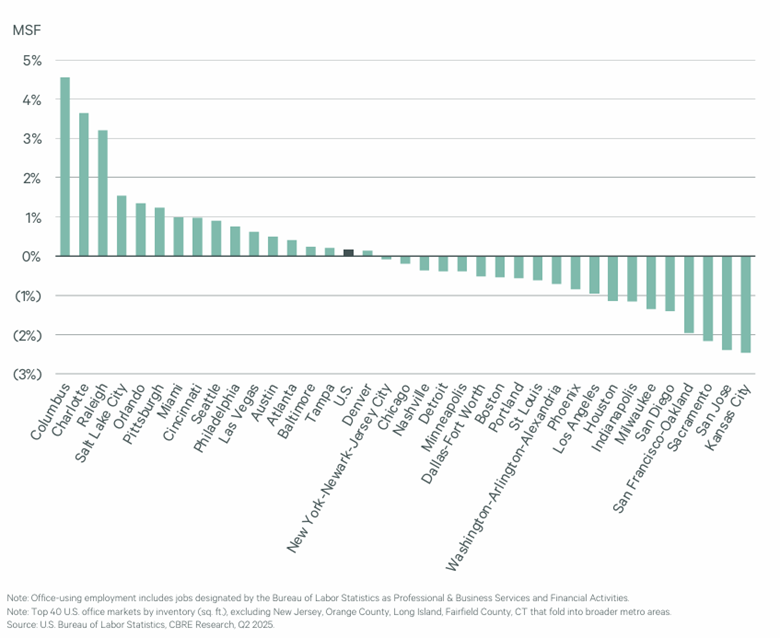
The highest year-over-year growth in office-using employment occurred in Columbus (4.6%), Charlotte (3.6%) and Raleigh, N.C., (3.2%), driven by the professional and business services sector, according to CBRE.
In contrast, San Francisco, Sacramento, San Jose and Kansas City experienced the steepest declines.
Leasing Activity
As construction pipelines continue to cool, U.S. office leasing has shifted toward high-growth secondary markets with existing space, rather than new development, according to CBRE.
Manhattan led the top 20 markets for leasing volume with a 12.1% share, followed by Los Angeles (5.6%), Chicago (4.9%), Washington, D.C., (4.8%) and San Francisco (4.2%).
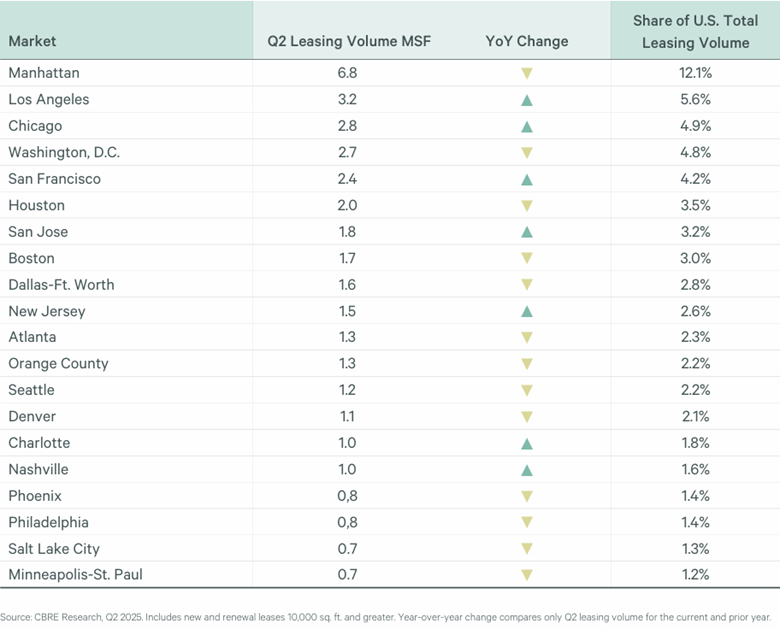
Year-over-year leasing volumes increased in Charlotte, Nashville, San Francisco, San Jose, Los Angeles, Chicago and New Jersey.
Conversely, declines were recorded in Houston, Dallas, Austin, Phoenix, Orlando, Orange County, Washington, D.C., Boston, Seattle, Denver, Philadelphia, Salt Lake City and Minneapolis/St. Paul.
Notably, Boston, Houston, Dallas and Austin maintain active construction pipelines despite softening demand — a dynamic that can contribute to rising vacancy rates.
Development Trends
Construction pipeline contracts represented less than 0.5% of total U.S. office inventory in Q2 — an 83% decline from Q1 2020, according to CBRE.
Developers are expected to complete 13.6 million s.f. in 2025, marking the lowest annual total since 2012.
Palm Beach County, Fla., (5.4%), Cleveland (3.1%), Austin (2.7%) and Miami (2.0%) have the most space underway as a share of their overall inventory. As these projects reach completion, vacancy rates may rise.
Demand Drivers
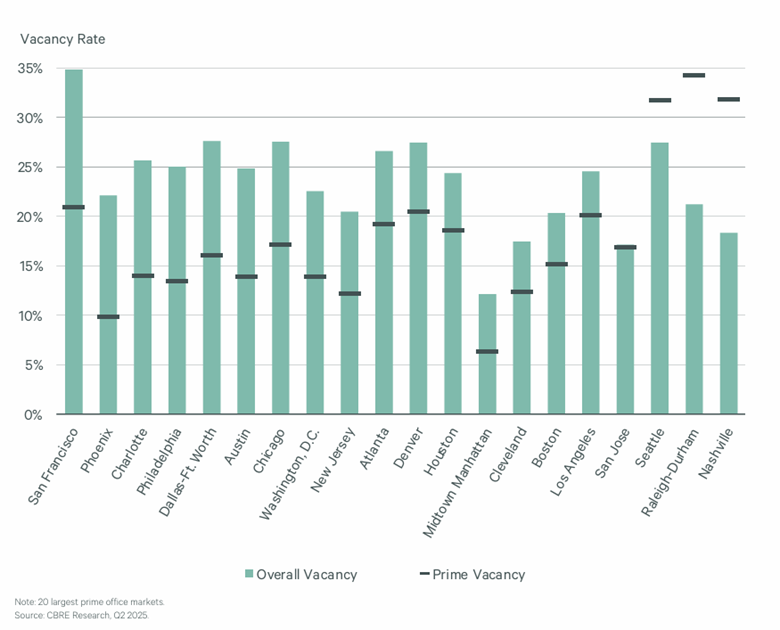
Prime buildings continue to outperform, underscoring occupiers’ ongoing flight-to-quality preferences, according to CBRE.
Prime vacancy rates in most markets remained lower than their overall rates in Q2. San Francisco, Phoenix, Charlotte, Philadelphia and Dallas/Fort Worth recorded prime vacancy rates more than 10 percentage points below each market’s overall vacancy rate.
However, Seattle, Raleigh and Nashville saw short-term increases in prime vacancy rates due to substantial office completions in recent years.
In Summary
While national trends point to a cooling construction pipeline and a steady shift toward quality space, regional dynamics reveal a more nuanced picture. Markets such as San Francisco and San Jose are showing signs of recovery, while others face rising vacancies due to ongoing development. As occupiers continue to prioritize flexibility and quality, understanding regional dynamics will be key to identifying opportunities and anticipating challenges in the evolving office sector.